

Managing Tail spend calls for a tool tailored to this type of expenditure. Although these purchases represent a small amount overall, the associated indirect costs are very high.
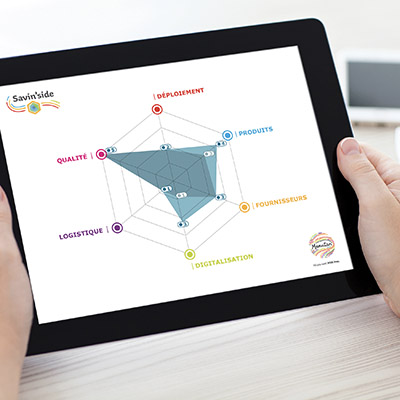
At Manutan, we propose a method for a 360° analysis of all cost centres in order to identify priority improvement plans. This type of analysis corresponds to a "health check-up", to monitor changes in these costs over time. The approach we have put in place is built on 4 key steps.
1. Analysis of existing contract coverage
We look at whether the customer’s first reflex is to turn to their selected suppliers for indirect purchases, and whether the associated processes are complied with. During this phase, we also analyse the quality of the service delivered, via two performance indicators:
- The contract coverage rate at the various subsidiaries or sites in order to identify "rogue buying zones" and implement control and communication plans.
- The complaint rate (ratio of complaints to orders), which tracks the quality of the service delivered by suppliers in order to identify root causes and address dysfunctions.
2. Analysis of purchasing process digitisation
E-procurement reduces the paperwork costs involved in transactions (in the procure–to-pay process). For this, we assess:
- The maturity of the P2P solution by surveying the digitisation tools in place: from access to the offering via an electronic catalogue (e-cat or PunchOut) to dematerialised invoicing and order flow digitisation (EDI or P2P platform).
- The use rate of the purchasing processes and solutions put in place, comparing the number of orders placed via digital solutions with the total number of orders received (by fax, telephone, mail, etc.).
3. Analysis of delivery processes
This step also includes the delivery of the products to the end user. At this point we look at:
- The number of deliveries per day and per site, to identify sites where there is potential to reduce supply costs, which in this case means the cost of transport and the time required to direct and unload delivery trucks.
- Product provision or distribution processes, to identify improvement areas. This might involve optimising inventory management, for example, or installing automatic vending machines.
4. Analysis of product and supplier portfolios
This final step helps to reduce the overall expenses entailed by products and by supplier management costs. For this, we assess:
- The consumption rate of premium products, to estimate the potential savings to be made by migrating part of this consumption to comparable but lower-cost products.
- The optimisation of the supplier portfolio, by analysing the number of suppliers in a given product category. This KPI (key performance indicator) is used to identify savings levers linked to lower supplier management costs, and above all to lower numbers of orders (more lines per order means fewer orders).
This 4-step method gives us an all-round "snapshot" of the costs involved in Tail spend, and enables us to identify real improvement opportunities.
Following these analyses, we dive deeper into the major levers to evaluate the real savings potential and formulate an initial action plan, which is validated with the customer.
After this "health check-up", a series of business reviews track progress to date, identifying new opportunities to optimise the cost of Tail spend as they arise.
This is also a method that we apply to produce benchmarks for each sector of activity, in order to compare a company’s purchasing behaviour with that of its peers.