

Today, procurement has established itself as a strategic function within businesses. This is why it has become imperative for every procurement department to manage its activities via a dashboard. This tool allows you to aggregate, analyse and visualise all procurement data. Procurement departments can thus manage their procurement activities, commit to a continuous improvement approach and transform their function into a true performance driver. The challenge then is to build a clear, relevant and interactive procurement dashboard.
The procurement dashboard, a strategic tool
The procurement dashboard is a visualisation tool that centralises your key performance indicators and represents them graphically. Tables, graphs, diagrams... break down complex data to make it accessible and understandable for everyone. This provides an overview of procurement data, from supplier performance to cost savings.
With a clear interface, procurement dashboards facilitate decision-making. This allows procurement teams to monitor indicators in real time, compare results to objectives and identify opportunities for improvement. They are also key communication tools with stakeholders, promoting transparency and collaboration within the company.
For Tom Mills, Procurement and Property Director at Bibby Financial Services[1], it's an opportunity to showcase your procurement activity. Here's his advice on how to achieve this: "Each slide should include: key performance indicators that interest management, visually impacting graphs and diagrams, and progress tracking (year on year, month on month...). I follow these rules in all my files. I don't always have sophisticated procurement technology to do it (it helps if you have one). But I religiously follow these rules. The value of procurement is about reliability and clarity. To develop your reputation in procurement, you need both of these elements."
Ideally, the procurement dashboard brings together and simultaneously conducts data analysis from different sources. To relieve teams, it also updates automatically.
The different types of procurement dashboards
There are different types of procurement dashboards. Each has its own purpose, presents different categories of information and is aimed at a target audience.
The strategic procurement dashboard
The strategic dashboard serves to guide long-term strategies. For example, you'll find total annual expenditure, expenditure by category and by supplier, total savings achieved... This dashboard gives decision-makers a global and forward-looking vision to make informed decisions.
The operational procurement dashboard
The operational dashboard aims to manage daily activities. It monitors procurement operations in real time and ensures they run smoothly. It includes open procurement requests, contracts nearing expiry, ongoing tenders and negotiations... This allows procurement teams to quickly adjust their actions.
The tactical procurement dashboard
The tactical dashboard aims to measure the performance of the team or a procurement project. It focuses more closely on negotiation results, savings achieved, closed procurement requests, procurement request cycle times, etc. This helps the procurement team manage specific actions to gain efficiency.
Procurement dashboard: how to choose your indicators?
It can be tempting to adopt models and key performance indicators observed elsewhere. However, each organisation must build its own dashboard that responds to its challenges, strategy and priorities. It should be entirely customised with relevant indicators, adapted to its situation.
For example, some organisations don't take financial KPIs into account. As Raphaël Galligani, procurement manager at motorway operator Sanef[2], explains: "In agreement with the company's management, I don't impose financial KPIs on my teams. Financial performance is indirectly induced by their other objectives."
But then, which key performance indicators should you monitor? Here are some examples, classified by theme.
Procurement efficiency
- Return on investment
- Proportion of procurement under control
- Savings achieved (vs objectives)
- Total Cost of Ownership
Effective implementation of contracts
- Cost/value correlation
- Average execution time
Sustainable procurement
- CO2 impact per purchased item
- Social impact of each supplier
Supplier performance
- On-time delivery rate
- Supplier satisfaction rate
- Supplier availability rate
Compliance with policies and processes
- Rate of purchases made outside contracts
- Procurement cycle duration
Quality and compliance
- Compliance rate with specifications
- Supplier defect rate
- Supplier contractualisation rate
Suppliers can also contribute
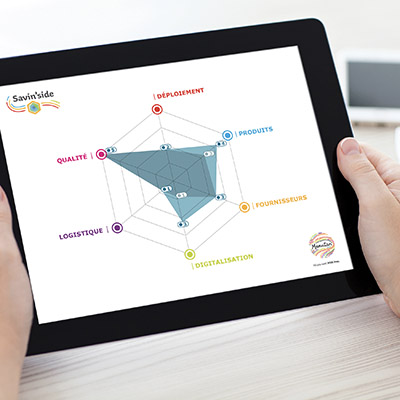
Mathilde Lahaie, procurement consultant at Manutan[3], adds: "As a reference distributor for long tail spend, we provide our clients with customised dashboards. This highlights six major optimisation areas, according to our Savin'side® method. For each area, we track specific KPIs: digitalisation rate, order amount, number of active sites.... We are now also incorporating a section on sustainable procurement with carbon footprint and breakdown by country of origin."
5 golden rules for effective dashboards
- Ensure readability with clear fonts, structured information and appropriate text sizes
- Reduce cognitive load through simple information, for maximum understanding
- Contextualise data with relevant annotations, visualisations and comparisons
- Harmonise colours by defining a palette for each theme
- Automate as much as you can, whether it's updating or sending.
Nowadays, the procurement dashboard is a formidable management, steering and communication tool for teams. To reap all the benefits, procurement teams must ensure it is relevant, well-designed and integrated into a continuous improvement approach. Procurement departments that can master this strategic instrument will have a competitive advantage.
[1] Tom, MILLS (Procurement and Property Director, Bibby Financial Services), LinkedIn, [https://www.linkedin.com/posts/tom-mills-procurement_procurement-dashboard-illustration-of-best-activity-7229760564728606720-3nNo?utm_source=share&utm_medium=member_desktop&rcm=ACoAAAQszAwByPq0-P8pWsEwO17sAUErSc2zeic]
[2] Raphaël, GALLIGANI (procurement manager, Sanef), Sanef: "Home-made dashboards in which we reprocess information from our procurement IS", 14 May 2024, Républik HA, [https://www.republik-achats.fr/strategie-ha/si-ha/sanef-des-tableaux-de-bord-maison-dans-lesquels-nous-retraitons-l-information.html]
[3] Mathilde, LAHAIE (procurement consultant, Manutan)