

The Pareto chart, often represented by a bar graph associated with a cumulative curve, is based on the Pareto principle or the 80/20 rule. Popularised by Vilfredo Pareto, a Pareto chart helps identify the major causes of a problem and prioritise actions in companies, particularly in procurement processes. This article guides you step by step: from understanding the concept to its practical application for quality improvement and optimisation of your procurement decisions.
Understanding Pareto's law and its application to procurement
Before creating a Pareto chart, it's essential to master the theoretical foundations of the principle and grasp its strategic usefulness for companies, particularly in procurement management.
Origin and theory of the Pareto principle
The Pareto principle, also called Pareto's law, originates from the work of Vilfredo Pareto, an Italian economist from the 19th century. While observing the distribution of wealth in Italy, he noted that 80% of the land was owned by 20% of the population. This observation gave birth to the famous 80/20 rule, according to which a minority of causes produces the majority of effects.
The Pareto chart is a graphical representation of this rule. It consists of a bar graph where categories or causes are ranked in descending order of importance, and a cumulative curve expressing the cumulative percentage of effects. This dual display allows for visually identifying the most influential elements of a given process or problem.
The power of this chart lies in its simplicity of analysis: by focusing on the 20% of major causes, a company can solve 80% of its problems, thereby optimising its resources and improving the quality of its operations.
Pareto's law and procurement categorisation
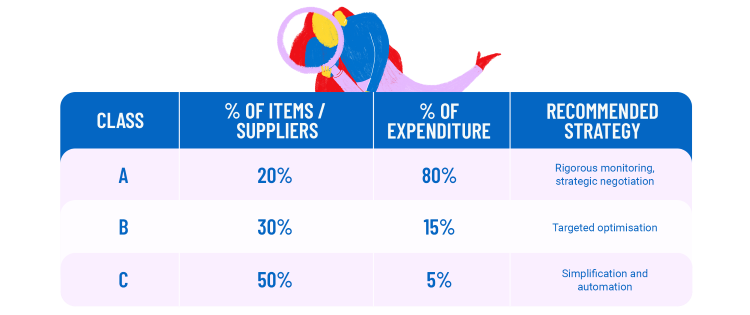
In the field of procurement, Pareto's law allows for fine categorisation of expenditures. We often talk about Spend classification, where items are sorted according to their financial commitment.
Natacha Tréhan[1], lecturer at Grenoble-Alpes University, researcher, CERAG and specialist in procurement management, specifies: "Purchases are categorised in two stages. First, we determine the financial commitment. To do this, buyers use a Pareto chart to distribute the references to three types of spend (head, mid-tail, and long tail). Long tail spend corresponds to 50% of the purchased references, but represents only 5% of the total procurement amount."
This type of analysis facilitates the identification of the most critical categories, on which to concentrate negotiation, rationalisation, or control efforts.
Why the chart is a strategic tool for companies
The Pareto chart is an essential prioritisation lever. It helps companies define priorities, highlighting problems with the greatest impact on quality, costs, or deadlines.
By visualising procurement data in chart form, decision-makers can adjust their processes in a targeted manner, addressing the problems that really matter. This analytical approach, aligned with the 80/20 rule, supports supplier rationalisation strategies and performance optimisation.
How to build a Pareto chart step by step
To fully exploit the Pareto chart, it's essential to follow a rigorous method. Here are the key steps to develop a relevant chart, from data collection to visualisation.
Data collection and classification
The first step is to precisely identify the problems or categories you wish to analyse. This might concern, for example, quality defects in a production line, expenditure by supplier, or causes of delays in a process.
Once these elements are identified, you need to measure their occurrence or impact, using quantifiable values:
- Number of incidents;
- Associated cost;
- Time lost;
- Etc.
These data will then be classified in descending order according to their importance. This sorting is fundamental, as the Pareto chart is based on the idea that only a few causes generate the majority of effects, in accordance with the 80/20 rule.
At this stage, each category must be associated with a percentage representing its contribution to the overall problem. This step prepares for visualisation.
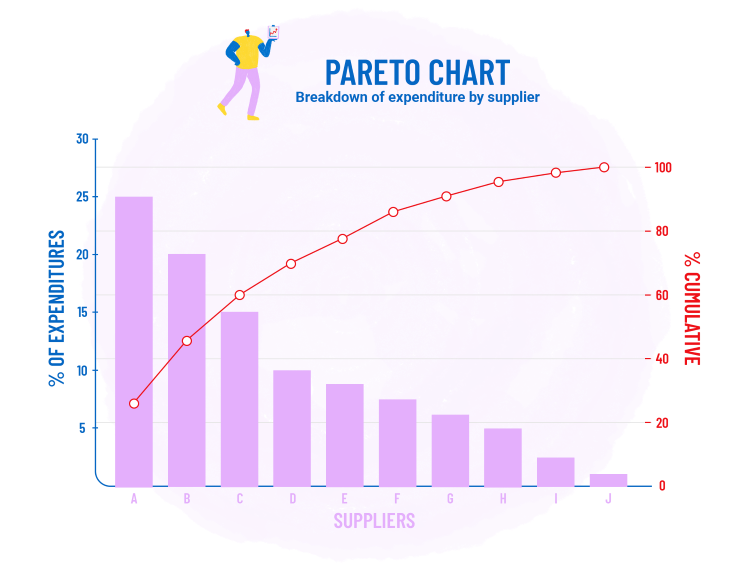
Creating the Pareto chart
The construction of the chart is done in two parts:
- The x-axis lists the identified categories (causes or problems);
- The y-axis displays the frequency or impact in % of each category.
Then, the individual values are represented in descending order by bars.
Next, the cumulative curve is added, which allows for visualising the share of each cause in the cumulative total. This curve follows the logic of the Pareto principle, highlighting that only a few elements concentrate the essential part of the problem.
A concrete case
A company wishes to optimise its expenditures by identifying the suppliers that represent the major part of its purchases. It therefore collects the necessary data and classifies them in a table.
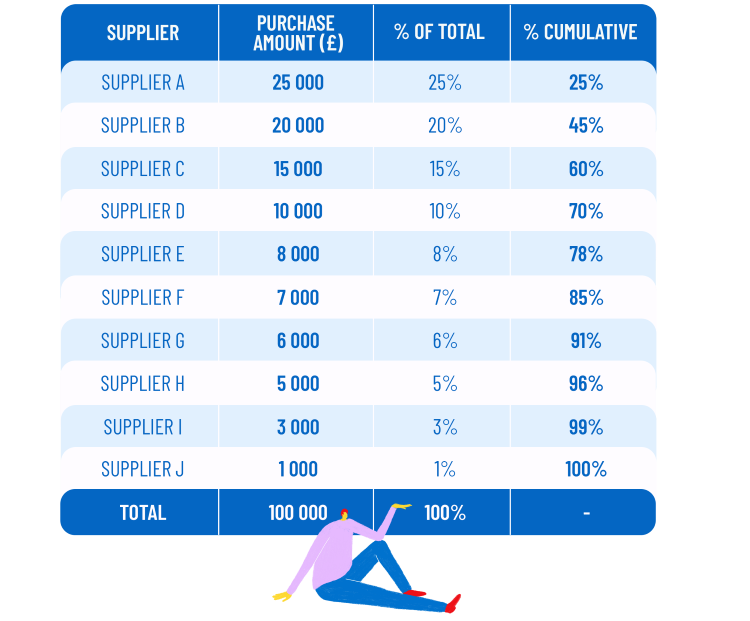
This table is then translated into chart form.
Tools and software to generate a chart
To create a Pareto chart, several tools are at your disposal. Excel offers a dedicated feature, accessible via combined charts. Power BI or other business intelligence tools also offer advanced options to automate the creation of this type of chart.
You can easily integrate these Pareto charts into your dashboards for dynamic monitoring of your procurement processes. Tips, such as automatic data updates allow you to keep your analyses up to date and optimise your decision-making.
Interpreting and using a Pareto chart in procurement
Once your Pareto chart is built, the decisive step is knowing how to read it and use it effectively to guide your strategic choices in procurement.
Detecting critical causes to address as priorities
Reading the Pareto chart relies on the analysis of the cumulative curve, which indicates the percentage share of each category in the entire problem. The objective is to quickly identify the critical causes, those that should concentrate your efforts to obtain tangible results.
Based on this reading, you can determine the head spend or incidents, i.e., the 20% of causes responsible for 80% of the impacts. This optimisation logic allows for targeted action on what has the most weight.
A company that knows how to prioritise its actions gains in efficiency, improves the quality of its procurement, and optimises its resources. Concentrating efforts on high-leverage issues thus becomes a strategic approach.
Use cases in the procurement field
The application of the Pareto chart in procurement is particularly relevant for managing indirect procurement or supplier relationships.
For example, by analysing your expenditures, you can reduce costs by focusing on the suppliers that represent the major part of your commitments. This allows for the rationalisation of the supplier panel by establishing solid partnerships with key players.
Natacha Tréhan[2] continues her analysis: "Indirect procurement represents 15% of the global procurement of large companies, but also 50% of orders and 80% of suppliers. This distribution demonstrates the importance of good categorisation and prioritisation of procurement."
Thanks to the chart, you can easily visualise this concentration, which facilitates decision-making.
Integration into a quality approach or Lean Management
The Pareto chart naturally integrates into a quality approach or Lean Management. It complements tools such as the 5S method, DMAIC, or Kaizen, which aim to improve processes and reduce waste.
By using the Pareto analysis, you can track the impact of your corrective actions, adjust your priorities, and measure effectiveness through performance indicators. The chart thus becomes a living tool, serving the continuous improvement of procurement.
[1] Natacha, TRÉHAN (Lecturer at Grenoble-Alpes University, researcher, CERAG and specialist in procurement management), Le débat, SMART @WORK, 05 December 2020, 27 min, B-Smart, [https://www.bsmart.fr/video/2063-smart-work-emission-05-decembre-2020]
[2] Natacha, TRÉHAN (lecturer at Grenoble-Alpes University, researcher, CERAG and specialist in procurement management), Le débat, SMART @WORK, 05 December 2020, 27 min, B-Smart, [https://www.bsmart.fr/video/2063-smart-work-emission-05-decembre-2020]