

The Savin'side® method aims to help companies optimise the total cost of ownership for indirect purchases. The approach focuses on three main phases: analysing a company's purchasing habits, implementing an improvement plan and monitoring its performance. Let's take a look at the example below, where a stakeholder from the agri-food industry decided to optimise the company's product mix.
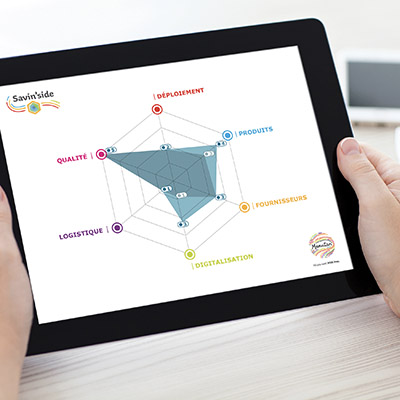
Savin'side® diagnostics
The first step was to analyse the company's tail spend, based on the various product types in the range. The results confirmed that high-end products made up the bulk of the product mix (45%), followed by mid-range products (36%), Manutan-branded products (12%) and budget products (7%).

There is a continuing trend among both one-off and non-recurring tail spend, where consumers are using products that exceed their quality requirements. In other words, these products go beyond users' needs in terms of quality, and cost considerably more than they should.
The aim of the improvement plan was to optimise the product mix of the company's tail spend by selecting an offer that was well-suited to employees in terms of the quality required.
£14,183 of savings
On a practical level, substituting certain high-end products with mid-range or budget products from the Manutan brand, which offer the same level of quality at a lower price, created many opportunities to save money. These changes enabled the company to save between 10 and 20% on each substituted product.
By analysing their consumption in detail, and with help from their tail spend supplier, the company was therefore able to identify suitable products for substitution. Together, they were able to find a balance in the product mix, as follows:
- High-end products: 25%
- Manutan-branded products: 17%
- Mid-range products: 41%
- Budget products: 17%

This new product mix, closely aligned with current expenditure, meant that the company could save £14,183.
|
Classification |
Expenses N-1 |
Expenses N+1 |
Savings |
|
High-end |
179,539 |
99,644 |
- |
|
Manutan |
47,578 |
63,377 |
4,039 |
|
Mid-range |
145,426 |
163,381 |
2,065 |
|
Budget range |
27,828 |
59,786 |
8,079 |
|
Total |
400,371 |
386,188 |
14,183 |
Thanks to the Savin'side® method, the company was able to optimise its product mix and save £14,183. As the company made headway with its progress plan, it also decided to optimise a second area—its logistical processes
- Do you want to save money on your indirect purchases too? Discover Savin'side®